Modares Vibration and Acoustics Technology Company with experienced manpower with the ability to provide services in the fields of condition monitoring , analysis and processing of vibration signals (Signal analysis), denoising , SVM learning machine, emergence detection (Novelty Detection) and …. The following is a brief description of each of these.
Condition Monitoring
Condition monitoring is based on checking and monitoring the current status of the machine in operation and predicting its future status. This means that information about the internal condition of the working machine can be obtained from outside. Condition monitoring is one of the main components of predictive maintenance
Different methods of status monitoring
Vibration Analysis
Oil Analysis
Yield Analysis
Thermography
Acoustic Emission
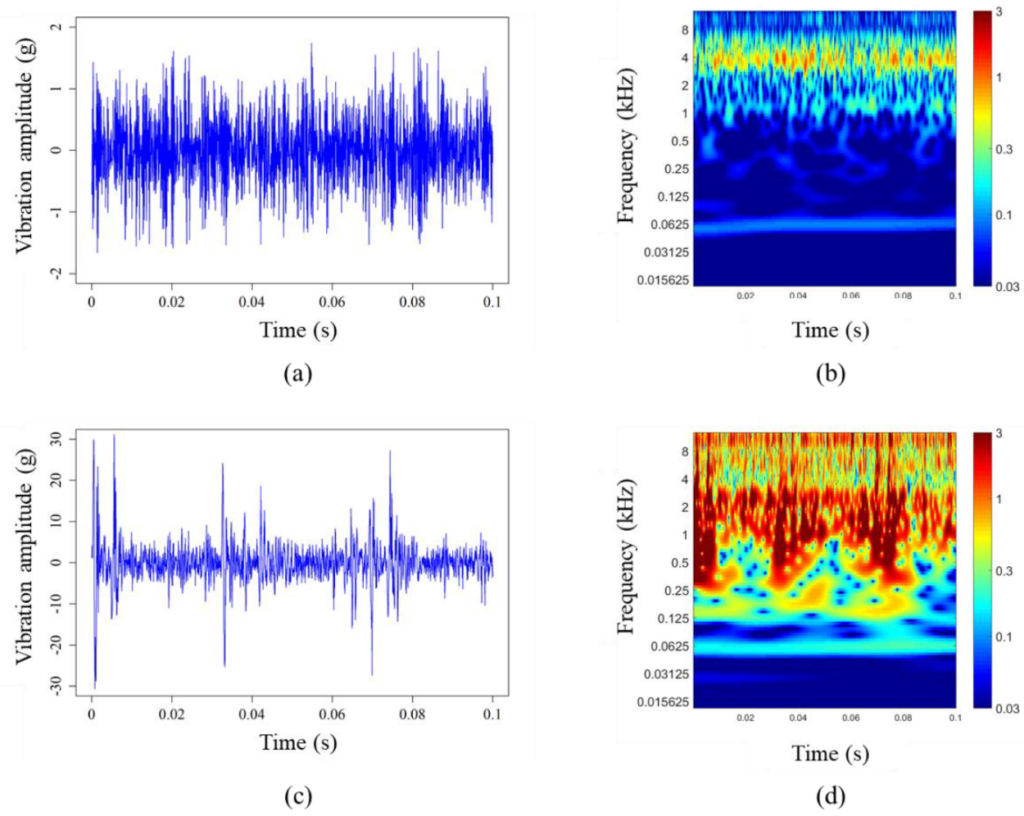
Vibration analysis is the most important and most widely used.
Vibration analysis
Under standard conditions, each machine has specific vibration effects. (Defect propagation alters these effects in a way that is related to the same defect.) Many of these vibrations are related to intermittent events in machine performance. Such as rotating shafts, engaging gear teeth, rotating electric fields and the like. The frequency of such events is usually repetitive and directly indicates the source. Vibration analysis is done in two main ways:
– Model-based: Linear, nonlinear and …
– data driven: processing vibration signals
Analysis and processing of vibration signals (Signal Processing)
In the case of rotating machines, the use of vibration signals such as acceleration, speed and displacement because these signals contain dynamic information about the state of the machine; It is effective in identifying and distinguishing between various defects. Methods of analysis and troubleshooting in rotating machines with the help of vibrating signals can be divided into the following three categories:
Time domain analyzes
Frequency domain analyzes
Time-frequency domain analyzes
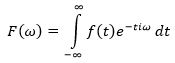
Time domain analyzes are directly based on time waveform. Traditional time domain analysis calculates characteristic features in the form of statistical descriptions of time waveform signals. Features such as mean, peak, crest coefficient, and high-order statistics such as root mean square, skewness, kurtosis, and more. These features, mostly called time domain features, are used with limited ability to detect local defects. Common time domain analytical approaches, such as simultaneous averaging, and the self-reversing model, are widely used to troubleshoot rotary machines. Frequency domain analyzes or spectral analyzes are generally performed by Fourier transform. Fourier analysis converts a time domain signal f (t) to a frequency domain; So that the generated spectrum F (ω) includes all the signal frequency content (base and harmonic) which is defined as the following relation:
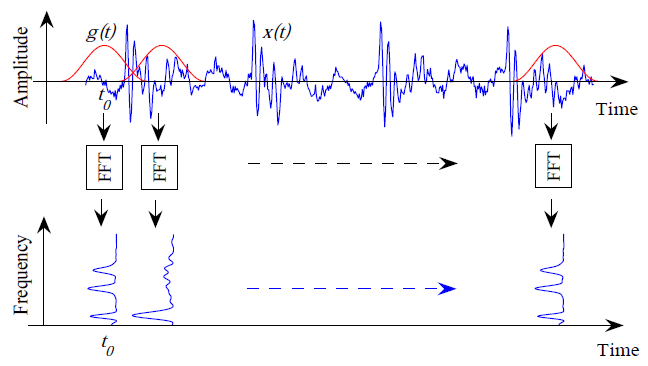
But the most important drawback of FFT is its inability to provide information about the time conditions of the signal spectrum; So that the results are averaged over the entire signal range. This will cause problems in the analysis of non-static signals. In such cases, having a relationship between the time and the frequency content of the signal can be useful. This severe limitation of FFT has led to the use of time-frequency signal analysis tools such as “Fourier transform short time” (STFT), or “Winger Ville distribution” (WVD) and so on. The STFT method converts a signal into a two-dimensional function of time and frequency. The short-time Fourier transform, or STFT, performs a “time-localized” Fourier transform on the x (t) signal sequentially, using a slider window function g (t) to temporally centered. As a result, changes in the frequency content of the signal contained within the time window function appear. This process can be seen in the following figure:
Schematic of STFT signal analysis steps
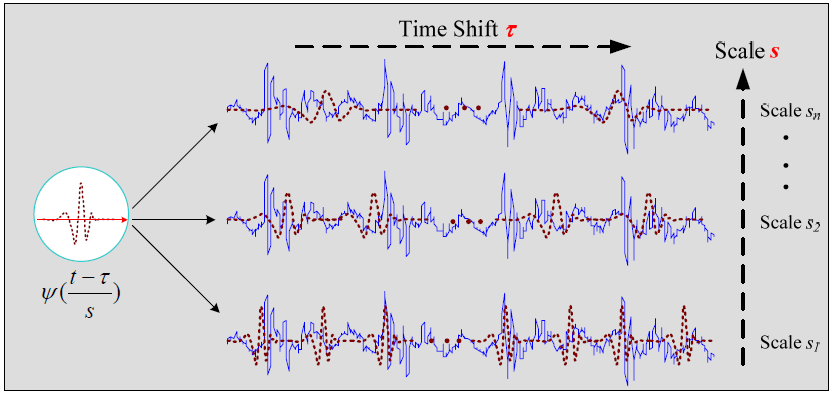
The problem with using STFT is that its accuracy in extracting frequency content is limited by the length of the window relative to the signal interval. When the window function is defined, the area of the window function (the result of time in bandwidth) on the time-frequency screen remains constant. This means that time separation and frequency separation do not increase simultaneously. Therefore, in STFT, there is a compromise between temporal and frequency separation
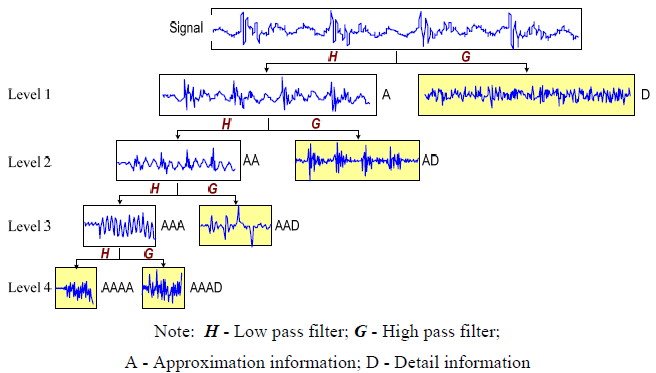
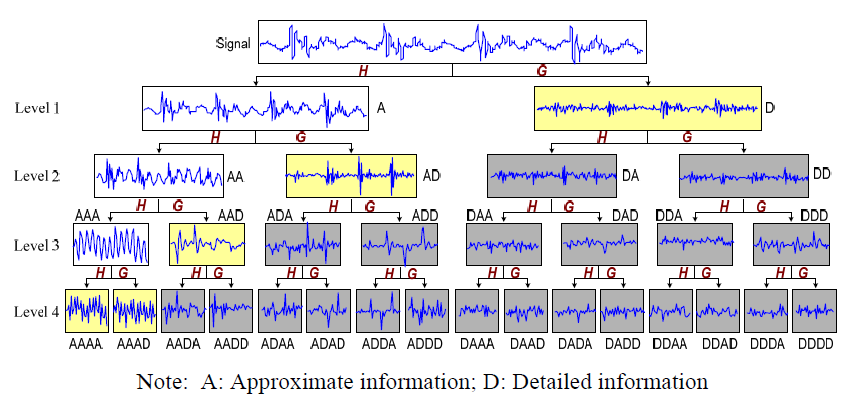
Scaling and shifting processes of a signal wavelet base
Wavelet transform is done in the following 3 ways: